
Brent crude settled at $90.04 on July 30, 2026. That is down fractionally on the day but still up more than 25% over the past month and 25% versus the same point a year ago. If that number feels anticlimactic given everything happening in the Gulf, it is because the market has been on a genuine roller coaster. Brent reached a high of $118 per barrel on April 29 and fell as low as $72 on June 26 inside a single quarter. The swings are not random noise. They are a direct read-through on whether the Strait of Hormuz is open, semi-open, or closed.
Market Snapshot
The energy complex is re-accelerating this week, and the reason is not complicated. Global oil prices have surged toward $100 per barrel as renewed hostilities between the US and Iran have brought traffic through the Strait of Hormuz to a near halt, while Tehran-allied Houthi forces have joined the conflict with attacks on tankers in the Red Sea and a naval blockade against Saudi Arabia in the Bab el-Mandeb Strait. That is two critical chokepoints simultaneously compromised.
Hormuz and Bab el-Mandeb together carry the equivalent of roughly a quarter of the world’s oil supply. That is the single most important geographic fact in energy markets right now.
The escalation has heightened risks to shipping through the Red Sea, with US Central Command launching a major wave of strikes targeting dozens of Islamic Revolutionary Guard Corps sites, while Yemen’s Iran-backed Houthi rebels continued to threaten Saudi Arabia and Saudi forces joined US operations against Tehran-linked militants in Iraq. The conflict has expanded well beyond a bilateral confrontation.
The IEA called this the largest supply disruption in oil market history. The conflict caused the restriction of nearly all traffic through the Strait of Hormuz. A ceasefire was signed June 17. It lasted about three weeks before fighting resumed. That matters for how traders should think about the current rally.
Why This Situation Is in Focus
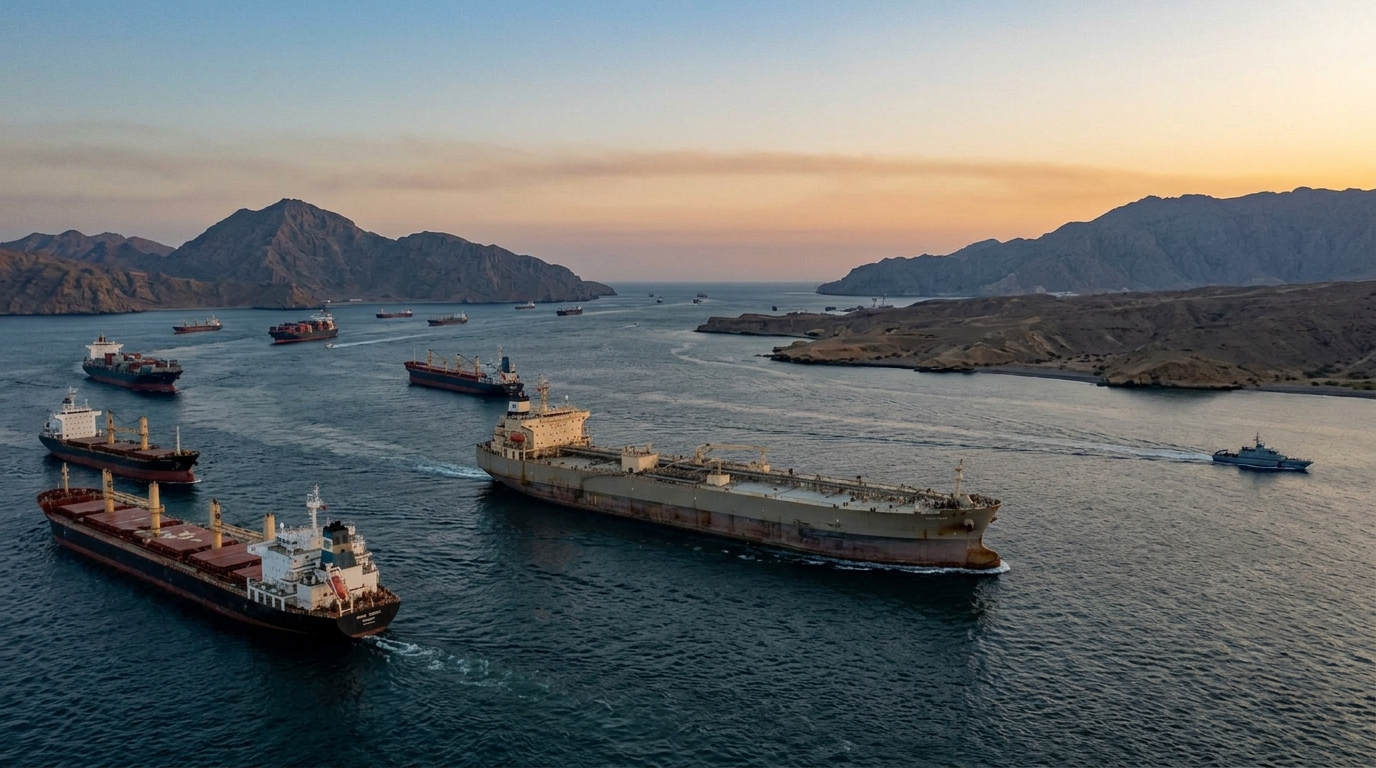
Here is the thing about the Strait of Hormuz that most casual observers miss. It is not just about Iranian oil. The Strait, which borders Iran and Oman, is a key waterway for the transit of oil, natural gas, and other commodities — including helium, fertilizers, and industrial products — to world markets. Roughly 27% of the world’s maritime trade in crude oil and petroleum products passes through it.
The Strait is almost 100 miles long and just 21 miles wide at its narrowest point, with shipping lanes in each direction approximately two miles wide. It is astonishing, really. The price of a barrel of crude in Tokyo, Mumbai, and Berlin is substantially determined by what happens inside a two-mile lane of water. The geography has no substitute at the required scale.
Saudi Arabia and the UAE do have alternative pipeline routes. But those pipelines don’t have anywhere near the capacity to replace Hormuz throughput. Iraq, Kuwait, and Qatar have no bypass at all. When the Strait effectively closes, those barrels stop moving.
Consultancy Rystad estimates a potential shortfall of 8 to 10 million barrels per day in the event of a full shutdown — an amount that no coalition of strategic reserve releases can fully replace. The IEA agreed to release 400 million barrels from emergency reserves during the worst of the crisis. That bought time. It did not fix the math.
The Technical Picture for Crude
The ceasefire premium unwind was sharp and fast. Brent had briefly touched $100-plus when strikes were at their peak, and the roughly 9% reversal on a ceasefire pause looked more like unwinding of the war premium than a fundamental shift in supply. That is what traders mispriced in late June.
Critically, tanker traffic through the Strait of Hormuz saw little meaningful recovery despite the diplomatic tone shift, and flows through Bab el-Mandeb remained well below normal. The supply disruption never fully healed. Now hostilities have resumed, and the market is being forced to reprice again.
The war risk insurance picture tells the same story. The sharp increase in war risk insurance costs threatens to further disrupt crude flows from the Persian Gulf, with additional war risk premiums jumping from 1%–3% of hull value weeks ago to 7.5%–10% currently, according to Marsh. For context: a $100 million tanker now faces war risk premiums of $3 million to $10 million, compared to roughly $250,000 prior to hostilities.
The United Nations International Maritime Organization documented eight ships hit between July 13 and July 20 alone, producing a two-tier market where more cautious tanker operators linger outside the strait while others conduct shuttle runs through the passage.
Slight tangent, but it matters: freight rates on crude tankers from the Middle East to China have reached levels equivalent to roughly $20 a barrel for cargoes discharged in eastern China, compared with an average of about $2.50 last year. That is an 8x increase in transportation cost. It flows directly into refiner margins, end-product prices, and inflation readings everywhere east of the Suez.
The Catalyst: Escalation, Diplomacy, and the Binary
This is a binary-driven market, which makes it unusually difficult to trade directionally with confidence. Every de-escalation signal sends crude down 5%–9%. Every resumed strike cycle sends it right back up, or higher. Uncertainty around the Strait produced an average daily price swing of $4 per barrel in April and May, versus $1 per barrel in the same months of 2025.
What traders need to watch is whether the current re-escalation looks more like the March–April peak cycle or the brief mid-July spike that reversed on a ceasefire signal. The difference matters enormously for positioning in energy versus everything else.
Here is where I am at: the June MOU was supposed to be a 60-day negotiation window. The US and Iran signed that memorandum of understanding on June 17, resulting in a period when large-scale hostilities had largely subsided — until the second week of July, when they resumed. Three weeks of relative peace. That is the entire runway before we were back to this.
Iran’s leadership is still in flux. Iran’s leadership is unstable, with a successor regime consolidating power amid an active internal struggle, and the IRGC has not stood down. That is the structural reason why calling a durable ceiling on this conflict is harder than the market has repeatedly assumed.
Risk Assessment: The Winners and the Bleed
Who wins. Energy and defense stocks have rallied, while travel shares — airlines, cruises, and hotels — have dropped every time the conflict flares. That has been the consistent pattern since February.
On the energy side, energy stocks are up roughly 40% year-to-date while defense stocks have been flat or lower. The pure-play E&P names have been the biggest beneficiaries. EOG Resources is up about 30% since the Iran war started. ConocoPhillips closed at $120.26 on July 24, up from $103.22 on July 1, though it is still off the April 29 peak of $128.25. That peak-to-current gap reflects exactly how much of the premium came out during the ceasefire period.
The oilfield services sector has also benefited. Baker Hughes gained 2.8% in the most recent session as oil prices jumped on renewed Middle East airstrikes. Refiners are in an unusual spot: the disruptions resulted in international buyers seeking alternative supply sources for petroleum products, driving up US refinery margins, production, and exports. US-based refiners processing domestic crude are capturing a spread that simply did not exist 12 months ago.
Who bleeds. Air carriers are confronting a dual challenge: rising operational costs and weakening demand elasticity, and analysts warn that sustained fuel inflation could force deeper capacity cuts and accelerated restructuring.
The numbers behind that are sobering. This is the first major crisis the airline industry has faced since widely ending the practice of fuel hedging in 2024 and 2025 — and jet fuel now accounts for more than 40% of airlines’ operating costs and has nearly doubled over the course of the conflict. United Airlines CEO Scott Kirby noted that jet fuel prices have more than doubled in a short span, representing an additional $11 billion in annual costs, and the carrier spent $11.4 billion on fuel in all of 2025. Those are the economics of a structurally different operating environment.
Cruise lines are in a similar bind. Cruise lines rely on heavy fuel oil and marine gas, and a 10% change in fuel cost per metric ton would reduce Carnival’s 2026 net income by $156 million, compared with $57 million for Royal Caribbean.
American drivers are facing fresh sticker shock after disruptions from the Iran war intensified in recent days, sending oil over $100 a barrel and national gasoline prices above $4 a gallon. Consumer-facing transport and logistics companies carry that burden directly into margins.
Trader’s Checklist
The specific developments to monitor before acting in either direction:
- Hormuz passage data in real time. Visible shipping traffic through Hormuz has virtually ground to a halt during the most intense conflict periods. Any resumption of meaningful transit volume is the single most bearish signal for crude.
- The diplomatic calendar. The June 17 MOU established a 60-day window. The clock on that framework has effectively restarted. Watch for any US–Iran back-channel signal, which has historically produced sharp 5%–9% intraday crude reversals.
- US crude inventory data. API data showed crude oil inventories fell by 3.3 million barrels last week, pointing to continued tightness in global oil supplies. Weekly draws of this magnitude at the same time as a Hormuz disruption are a compounding supply signal.
- EOG earnings on August 5. EOG reports Q2 results next week. Geopolitical disruptions have tightened oil markets, with robust pricing expected over the next few years. The Q2 earnings window will capture Brent at its Q2 average well above $100, meaning consensus estimates may be conservative.
- Airline guidance revisions. Some carriers have already revised financial guidance, with American Airlines cutting its 2026 forecast citing fuel-driven margin pressure. Watch for similar moves from Delta and Southwest if Brent breaks back above $95 and holds.
- SPR posture. US commercial crude inventories remain roughly 5% below the five-year average, and the Trump administration has signaled it intends to refill the Strategic Petroleum Reserve — which means the government is a structural buyer, not a seller, removing a key bearish supply buffer from the equation.
The $100 level is not a ceiling. It is a threshold the market has now crossed twice and retreated from twice. Whether the third test holds depends almost entirely on whether the Strait reopens in a durable, verifiable way — something five months of conflict have yet to produce.